First, inspect what was aligned, flagged and withheld. Then see how plot-scale variation determines the replication needed for a small yield difference.
Measured machinery findings. Prospective power scenarios. No client trial, calibrated sensor correction or causal yield gain is claimed.
01 / MACHINERY DATA
Align the frame. Keep the audit trail.
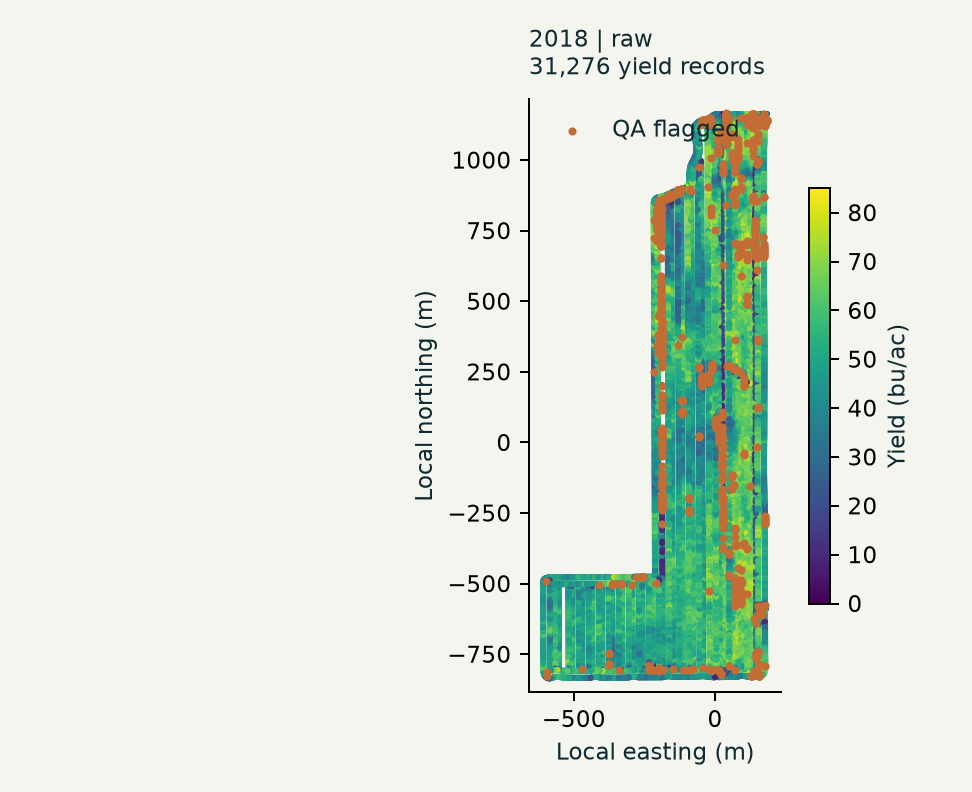
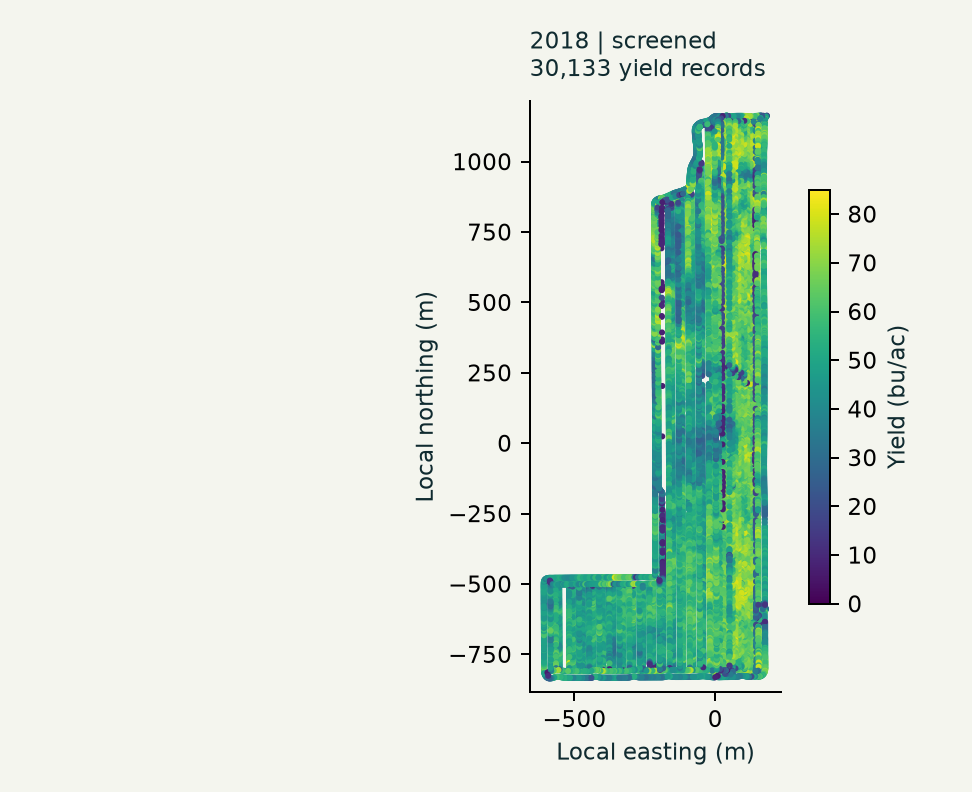
2018 harvest positions are in WGS84 degrees; application points are in UTM 12N meters. We reproject the harvest into the application frame. The measurements remain intact.
Same coordinate frame, extent and yield scale within each harvest.
ORIGINAL RECORDS 31,276QA RETAINED 30,133
QUALITY SCREENING1,143
unique records flagged
ACCEPTED SPATIAL MATCH50.8%
15,302 of 30,133 QA-retained records
JOIN RULE / DATA LIMIT
Nearest application point within 12 m. Coordinate reprojection does not establish GNSS accuracy.
What was found, and what we did.
Diagnostic
2018
2016
Action
Coordinate-system mismatch
Degrees vs meters
Same source projection
Transform 2018 to EPSG:32612; preserve the unspecified 2016 datum.
Duplicate x / y / yield
5
197
Keep first in the analysis view; preserve the full ledger.
Non-positive yield or flow
0
1,146
Flag and exclude; no replacement values.
Speed below 1.5 mph
342
Not supplied
Screen 2018; no invented 2016 speed.
Moisture outside 8–22%
247
82
Flag outside the stated range.
Non-positive swath
0
833
Flag and exclude; source units retained.
Yield percentile tails
626
1,501
Screen outside central 98% of positive values.
Conflicting polygon rates
Not applicable
592 raw cases
Withhold joins when overlap rate spread exceeds 5 source lb/ac.
Quality reasons overlap. These screening choices can flag legitimate extremes; they are not all proven machine errors. All original rows remain inspectable.
COVERAGE / 2018
A wider radius does not repair the gap.
8 m matches 47.0% of QA-retained yield; 12 m matches 50.8%; 20 m matches 51.3%. Only 162 records are added from 12 to 20 m.
Proximity alone does not prove time alignment or randomized treatment assignment.
ACCURACY / UNRESOLVED
Small separation is not independent control.
13,136 QA-retained harvest points are within 1 mm of an application coordinate. Numerical coincidence in source positions is not evidence of sub-millimeter GNSS accuracy.
Sensor delay, GPS drift, antenna offsets and yield calibration need supporting instrument evidence before a physical correction can be claimed.
The 2018 GeoJSON retains original WGS84 positions. No WGS84 layer is exported for 2016 because its datum is unspecified.
02 / FIELD-TRIAL REPLICATION
Count independent plots. Start with the variance.
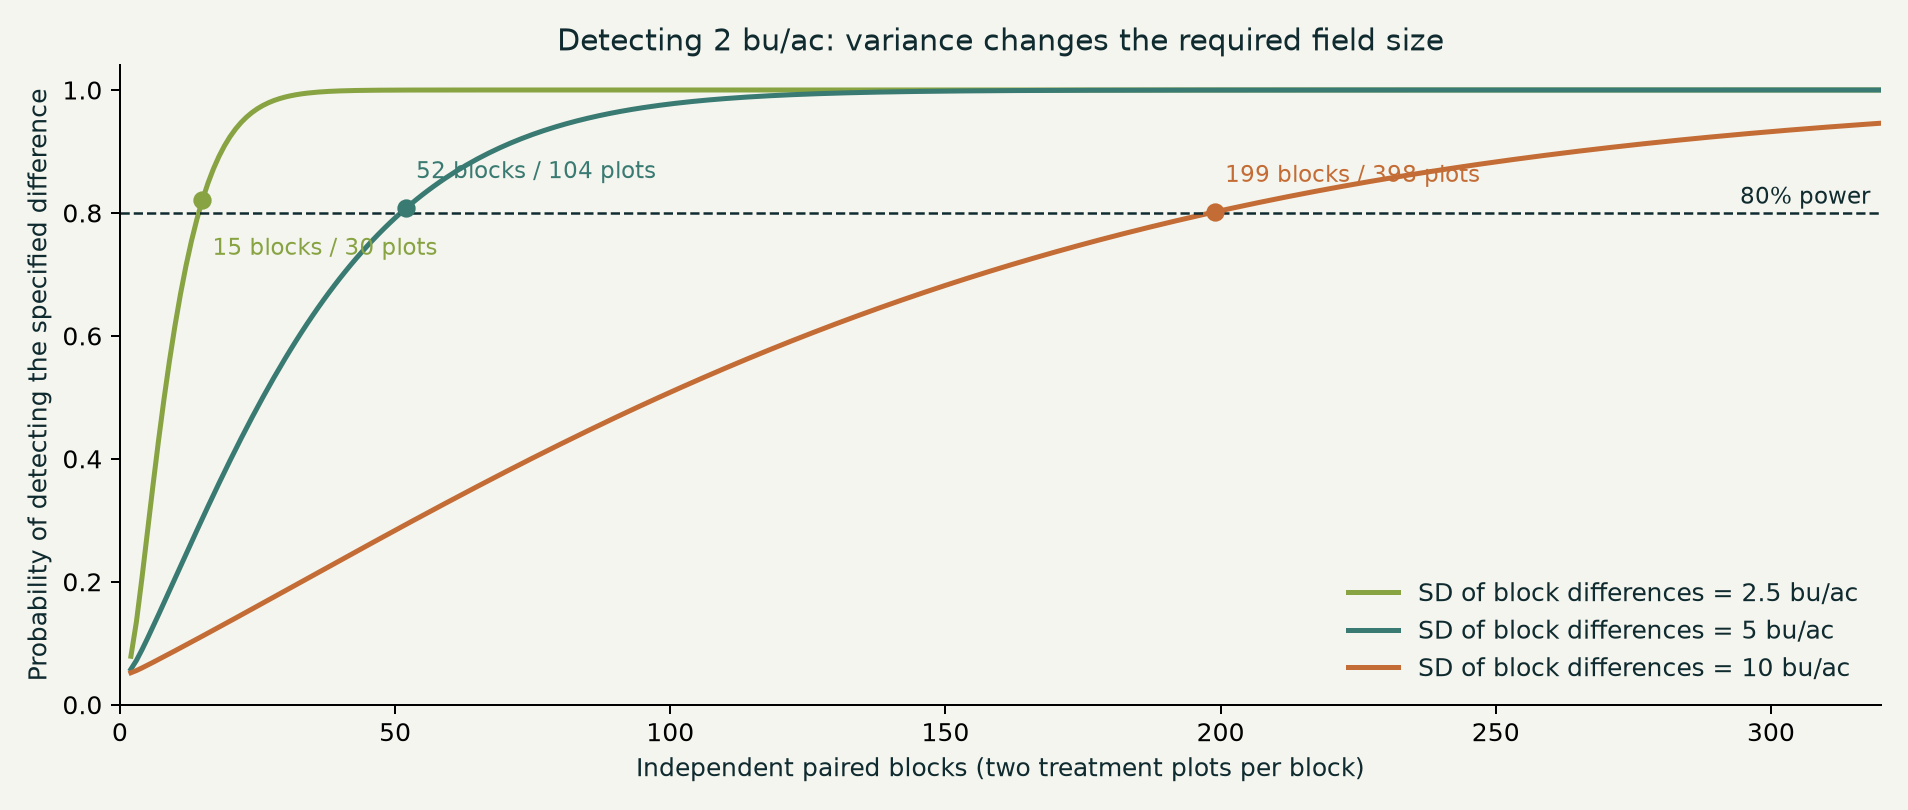
Two treatments, randomized within independent paired blocks. Each block contains one A plot and one B plot. GPS records within those plots are subsamples.
Two-sided alpha = 0.05. Exact paired-t power under normal, independent block differences. These are scenario inputs, not measured client variance.
COMPLETE PAIRED BLOCKS REQUIRED
52
104 total plots / 52 per treatment
80.78% calculated power
Before plot or pair losses. Validate plot-scale variance and the planned design before choosing a field layout.
FIXED EFFECT: 2 BU/AC / 80% TARGET LINE / TWO PLOTS PER BLOCK
A BETTER VARIANCE ESTIMATE
Use pilot plot means. Test the proposed design.
Estimate the SD of paired treatment differences from comparable replicated trials or a pilot. If the two plot SDs equal σ and their within-block correlation is ρ, then SD(D) = σ√[2(1−ρ)].
The historical 20 m-cell residual SD is a proxy, not a validated estimate of independent trial-plot variation. Multi-farm, multi-season and spatially correlated designs need their own analysis.
IMPLEMENTATION / VERIFICATION
Plan for operations. Check calculation behavior.
52 complete pairs with an assumed 10% pair loss means scheduling 58 blocks / 116 plots for expected retention. This is not a guarantee. Machine width, plot size, buffers and harvest calibration still need a protocol.
20,000 simulations per validation scenario agree with exact power within four Monte Carlo standard errors. Simulated zero-effect rejection was 4.88% against nominal 5%.
The 8-page report contains the full handling rules, match sensitivity, assumptions, replication table and references. The project includes source hashes, audit rows, scripts and original frozen files.